Key performance indicators (KPIs) measure how the NHS screening programmes are performing and aim to give a high level overview of programme quality.
This blog article updates you on the latest KPI data publications.
Quarter 2 and 3 KPI data for 2018 to 2019
We have published the KPI data for the third quarter of 2018 to 2019 (1 October to 31 December 2018). The data is split into 2 publications, one for the antenatal and newborn (ANNB) KPIs, and one for the young person and adult (YPA) KPIs.
Data for a few of the KPIs is collected later than the others, so we have also updated the Q2 KPI data files for:
- CS1 and CS2 – cervical screening coverage (under 50 and 50 and above)
- BSC2 – bowel cancer screening coverage
- FA2 – fetal anomaly ultrasound coverage
Highlights of the data
Three of the KPIs reached or remained at record high national performances in Q3 2018 to 2019. They were:
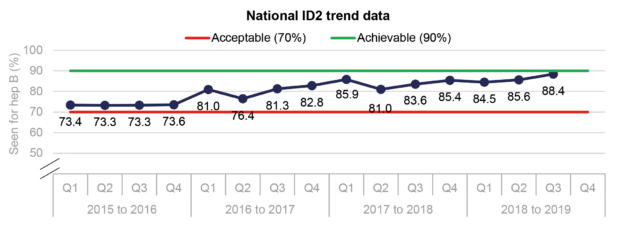
- the infectious diseases in pregnancy screening KPI for the timely assessment of women with hepatitis B (ID2) at 88.4%%
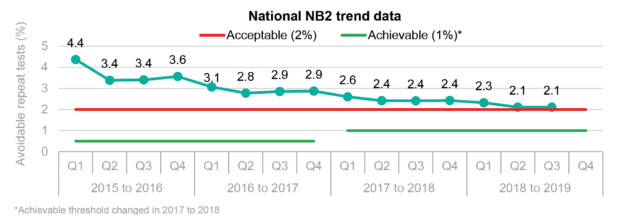
- the newborn blood spot screening KPI for avoidable repeat tests (NB2) at a record low of 2.1% (the lower the percentage the better)
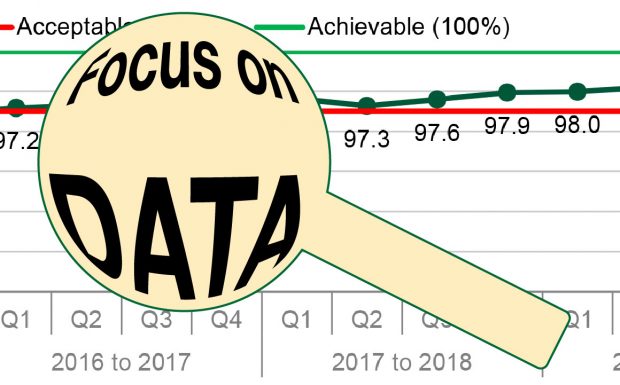
- the antenatal KPI for completion of laboratory request forms for fetal anomaly screening (FA1) at 98.2
Two of the 3 diabetic eye screening KPIs also showed significant improvements in Q3. National performance of the KPI for uptake of routine digital screening (DE1) was 83.1%, the highest it has been for 3 years.
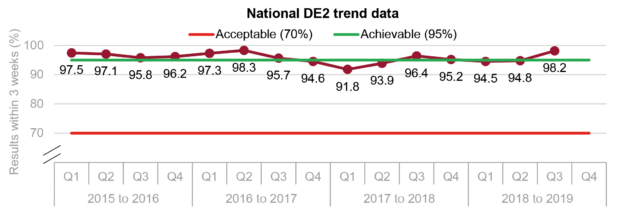
National performance of DE2, which is the indicator for results issued within 3 weeks of routine digital screening, digital surveillance, or slit lamp biomicroscopy was 98.2%, above the achievable threshold and the highest it has been for 2 years.
Summary factsheets report
We have also published our latest KPI summary factsheet report which includes:
- highlights of the data
- national trend information up to the most recent quarter available
- regional quarterly performance
You can use the links in the indexes to go to each KPI, and there is a link on each factsheet to take you back to the index again.
As always when looking at the KPI data, you should also look at the definition of each KPI from our definitions document, so you are aware of any new thresholds or revised definitions.
New templates
Please be aware that the Q4 (2018 to 2019) templates for maternity services and for child health information systems were published on 1 May. These are for submitting KPIs for the antenatal, newborn blood spot and newborn and infant physical examination programmes.
Please send any queries, suggestions or feedback about the KPIs to the PHE Screening Helpdesk.
PHE Screening blogs
PHE Screening blogs provide up to date news from all NHS screening programmes. You can register to receive updates direct to your inbox, so there’s no need to keep checking for new blogs. If you have any questions about this blog article, or about population screening in England, please contact the PHE screening helpdesk.
Recent Comments