Key performance indicators (KPIs) are used to measure how the NHS screening programmes are performing. We have previously blogged about what the KPIs are and how important it is to get good quality data.
In these reports we currently publish data on 17 KPIs across the screening programmes; 6 for antenatal, 7 for newborn and 4 for adult. See table 2 below for the full list, we are looking into including additional KPIs to cover all of the screening programmes.
Annual KPI data for 2014/15 (April to March)
We have recently published the annual KPI data for 2014/15 (April to March). This report includes only providers where there was a valid submission in each quarter. Here are a few key points:
- The national averages show that the acceptable thresholds were met for 10 KPIs and achievable thresholds were met for 4 KPIs (table 1).
Table 1:
| KPI Code | KPI Description | Acceptable threshold | Achievable threshold | 2014/15 national average |
| ID1 | HIV coverage | ≥ 90.0 | ≥ 95.0 | 98.9 |
| ID2 | Hepatitis B referral | ≥ 70.0 | ≥ 90.0 | 68.4 |
| FA1 | Laboratory form completion | ≥ 97.0 | = 100 | 96.6 |
| ST1 | Coverage | ≥ 95.0 | ≥ 99.0 | 98.9 |
| ST2 | Timeliness of test | ≥ 50.0 | ≥ 75.0 | 51.2 |
| ST3 | Completion of FOQ | ≥ 90.0 | ≥ 95.0 | 95.7 |
| NH1 | Coverage | ≥ 95.0 | ≥ 99.5 | 98.0 |
| NH2 | Test within 4 weeks of referral | ≥ 90.0 | = 100 | 86.2 |
| NP1 | Coverage | ≥ 95.0 | ≥ 99.5 | 93.3 |
| NP2 | Timely assessment (DDH) | ≥ 95.0 | = 100 | 47.9 |
| NB1 | Coverage | ≥ 95.0 | ≥ 99.9 | 95.8 |
| NB2 | Avoidable repeats | ≤ 2.0 | ≤ 0.5 | 2.7 |
| NB3 | Timeliness of result | ≥ 95.0 | ≥ 98.0 | 99.5 |
| DE1 | Uptake of digital screening event | ≤ 70.0 | ≤ 80.0 | 82.9 |
| DE2 | Results issued within 3 weeks | ≥ 70.0 | ≥ 95.0 | 96.5 |
| DE3 | Timely assessment for R3A screen +ve | ≤ 80.0 | - | 76.7 |
| AA1 | Completeness of offer | ≥ 90.0 | ≥ 100.0 | 97.3 |
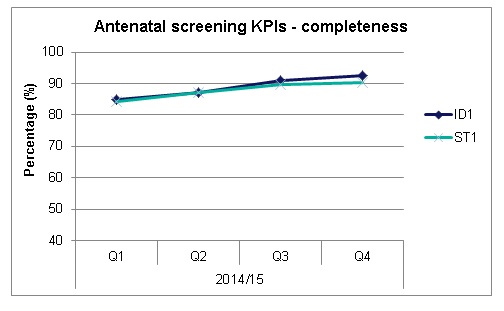
- Completeness of data (where providers submitted data for all 4 quarters) for the antenatal and newborn screening programmes has improved since 2013/14 but remains an issue. Across the antenatal programmes completeness ranged from 80% (ST1: sickle cell and thalassaemia coverage) to 99% (ID2: timely referral of hepatitis B positive women) over 2014/15. However completeness across the 4 quarters in the year improved for ST1 and ID1 (antenatal screening coverage for HIV), see figure 1.

- Completeness of data provided by child health record departments (NB1 and NB3: newborn blood spot coverage and timeliness of result) was 78% for the year
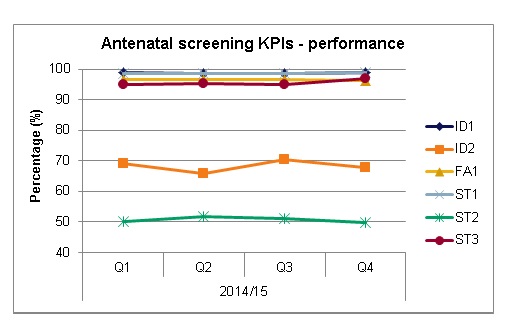
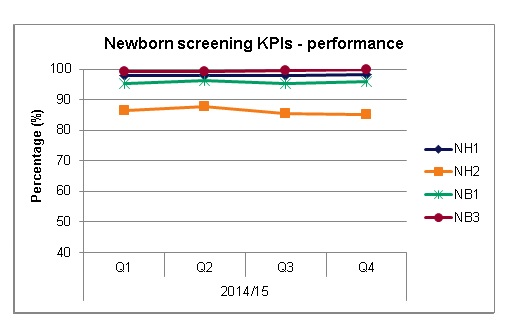
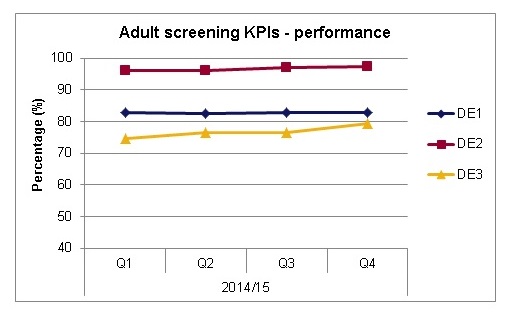
- Of providers who did submit data, the screening indicators for coverage remain high nationally; antenatal HIV (ID1) and sickle cell and thalassemia (ST1) both at 98.9%, newborn hearing (NH1) at 98.0% and newborn blood spot (NB1) at 95.8%. See figure 2 for antenatal screening KPIs, figure 3 for newborn screening KPIs and figure 4 for adult screening KPIs.


Caveat: We do not recommend using NP1 or NP2 data as performance measures because of low completeness. NB2 not shown (reverse polarity, low percentage KPI)

Caveat: AA1 is an annual indicator. Quarterly figures are aggregated from Q1 to Q4
Q2 2015/16 (July to September)
We have also published the most recent quarterly data, which is for Q2 2015/16 (July to September). Again, here are some highlights:
- The national averages show that 12 KPIs met their acceptable thresholds, including:
- ID2, which has now reached the acceptable threshold of 70% for the last 2 quarters (Q1 and Q2 2015/16), however this is a small number KPI therefore performance should be interpreted with caution
- FA1 (completion of laboratory request forms for fetal anomaly screening) has reached the acceptable threshold of 97.0% for the first time in Q2 2015/16
- DE3 (timely assessment for R3A screen positives for diabetic eye screening) reached the acceptable threshold of 80% for the first time in Q1 2015/16 and has maintained this in Q2 2015/16, however this is also a small number KPI therefore performance should be interpreted with caution.
- 6 KPIs reached their achievable thresholds, including:
- ST1 which has reached the achievable threshold of 99.0% for the last 3 quarters (Q4 2014/15, Q1 and Q2 2015/16)
- There were 99 KPI submissions for NP1 (coverage of newborn and infant physical examination), which is an improvement on 74 in Q1.
- Except for NP1 and NP2 (which we do not recommend to use as a performance measures due to low completeness) and AA1 (which is a cumulative annual indicator), the difference between Q2 and Q1 national averages for all KPIs was less than 1 percent.
Table 2. List of all KPIs with code and description
| KPI | Description |
| ID1 | Antenatal infectious disease screening – HIV coverage |
| ID2 | Antenatal infectious disease screening – timely assessment of women with hepatitis B |
| FA1 | Fetal anomaly screening – completion of laboratory request forms |
| ST1 | Antenatal sickle cell and thalassaemia screening – coverage |
| ST2 | Antenatal sickle cell and thalassaemia screening – timeliness of test |
| ST3 | Antenatal sickle cell and thalassaemia screening – completion of FOQ |
| NB1 | Newborn blood spot screening – coverage (CCG responsibility at birth) |
| NB2 | Newborn blood spot screening – avoidable repeat tests |
| NB3 | Newborn blood spot screening – timeliness of result availability (CCG responsibility at birth) – Replaced by NB4 from Q1 2015/16 |
| NB4 | Newborn blood spot screening – coverage (movers in) |
| NH1 | Newborn hearing screening – coverage |
| NH2 | Newborn hearing – time from screening outcome to attendance at an audiological assessment appointment |
| NP1 | Newborn and infant physical examination – coverage (newborn) |
| NP2 | Newborn and infant physical examination – timely assessment of developmental dysplasia of the hip (DDH) |
| DE1 | Diabetic eye screening – uptake of routine digital screening event |
| DE2 | Diabetic eye screening – results issued within 3 weeks of routine digital screening |
| DE3 | Diabetic eye screening – timely assessment for R3A screen positive |
| AA1 | Abdominal aortic aneurysm screening – completeness of offer |
| AA2 | Abdominal aortic aneurysm screening – coverage of initial screen |
| AA3 | Abdominal aortic aneurysm screening – coverage of annual surveillance screen |
| AA4 | Abdominal aortic aneurysm screening – coverage of quarterly surveillance screen |
PHE Screening blogs
PHE Screening blogs provide up to date news from all NHS screening programmes – replacing our previously published newsletters.
You can register to receive updates direct to your inbox, so there’s no need to keep checking for new blogs.