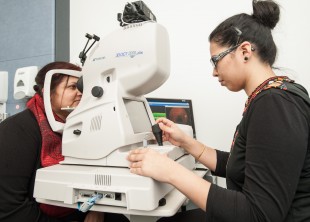
Expert graders are central to the success of the NHS Diabetic Eye Screening (DES) Programme. They study the digital photographs taken at screening clinics to assess if patients need to remain in routine screening or be referred for closer monitoring or treatment.
They grade images according to levels of:
- diabetic retinopathy, from no retinopathy (R0) to proliferative retinopathy (R3)
- diabetic maculopathy – either absent (M0) or present (M1)
This grading process needs to be of consistently high quality to ensure patients requiring treatment are referred in a timely manner.
The DES software includes some clever maths to produce tables that show just how consistently graders are identifying the correct level of disease in an eye and agreeing with the final screening result.
Local programme grading leads can then use these inter-grader agreement (IGA) tables to assess how well their graders are performing, which then enables them to highlight any issues.
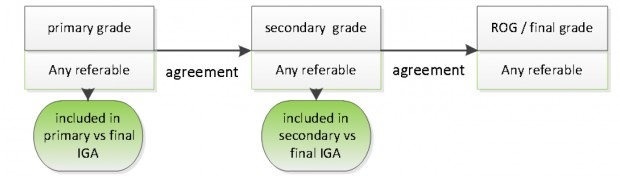
The IGA tables compare each grader’s results with the final grades attributed to patients.
The tables look at how closely two graders agree with each other compared with the final grade for each image. All cases of disagreement with the final grade are included in the table. Cases of agreement when an individual is the final grader are excluded from their table as their performance cannot be compared with themselves.
The IGA table displays a simple rate of agreement for an individual. This is the number of cases where their grade agrees with the final grade divided by the total number of cases in their table. For example, 80 agreements out of a total of 100 grades would give an inter-grader agreement rate of 80 ÷ 100 or 80%.
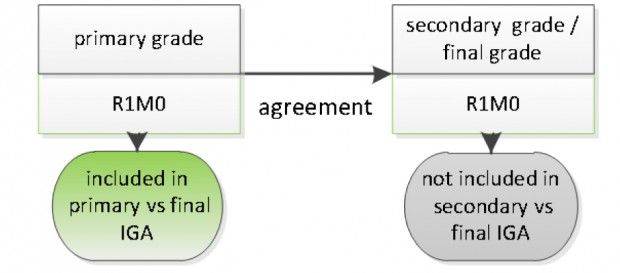
If you are a primary grader, you are the only grader for 90% of images that you grade as having no disease (R0M0), so these cases are not included in your IGA table.
If you are a secondary grader, you are the final grader of all agreed R0 (10% QA cases) and background retinopathy (R1) cases and these cases are not included in your IGA table. If you are grading at secondary level, you are the final grader for more cases which are agreed than if you are grading at primary level.
Because of this, tables showing secondary level grader agreements will always have a lower IGA rate compared to primary level grading tables.
Cohen’s kappa
Cohen’s kappa (k) is a statistical measure that is generally thought to be a more robust way of working out the rate of agreement than a simple percentage agreement calculation. This is because it takes into account the possibility of agreement on grades occurring by chance.
For example, the simplified table below shows how Cohen’s kappa is calculated for the rate of agreement between a primary and final grader for 100 images. The blue numbers are the actual grades – the primary grader referred 40 patients and the final grader referred 20 – and the red numbers indicate the number of grades that would have been expected to be agreed by chance.
| Final grader | |||
| Primary | Refer | Not refer | Total |
| Refer | a (8) | c (32) | 40 |
| Not refer | b (12) | d (48) | 60 |
| Total | 20 | 80 | 100 |
The total number of grades is 100. The primary grader referred 40 patients but the final grader only referred 20 patients.
To work out the kappa calculation for the number of grades you would expect to be agreed by chance:
- Cell a (agreements on refer grades) = 20 x 40 ÷ 100 = 8
- Cell d (agreements on non-refer grades) = 80 x 60 ÷ 100 = 48
Therefore the total number of grades you would expect to be agreed by chance = 8 + 48 = 56.
In fact, in the example above, the graders actually agreed on 80 of the 100 cases (20 refer + 60 not refer). They therefore agreed 24 grades in addition to the 56 cases that could have been agreed by chance. If they had been in perfect agreement they would have agreed 44 grades in addition to those that could have been agreed by chance (56+44=100).
Cohen’s kappa is calculated by dividing the number of actual agreed grades (minus chance agreements) by the total number of possible agreed grades (minus chance agreements).
In this case, Cohen’s kappa is therefore 24 ÷ 44 = 0.54.
Drawbacks when using Cohen’s kappa
There is no national benchmark for what is considered to be good or inadequate performance when using the kappa calculation. However, programmes can still use kappa to spot trends in performance and identify staff who might be outliers compared to their colleagues.
Kappa should never be reported without the table that includes observed number of grades from which it is calculated.
You can find out more about monitoring grading by visiting the assuring the quality of grading publication on GOV.UK.
PHE Screening blogs
PHE Screening blogs provide up to date news from all NHS screening programmes – replacing our previously published newsletters.
You can register to receive updates direct to your inbox, so there’s no need to keep checking for new blogs.
Recent Comments