In February 2019, the Leicester, Leicestershire and Rutland abdominal aortic aneurysm (AAA) screening programme had our second quality assurance (QA) visit from the PHE screening quality assurance service (SQAS).
A challenge from QA
At the time we had been under a lot of pressure with staff shortages and our main priority had been to screen the men on time.
It was therefore no surprise that one of the recommendations of the SQAS visit report was about tackling inequalities. This was something we had not had the capacity to focus on during 2018 and 2019.
The recommendation called on us to “utilise the health inequalities data report available in the SMaRT software and use the findings to inform the AAA workstream for the screening health and inequalities group”.
Largely due to the QA visit highlighting our staffing problems, we were able to recruit over the summer our team of 4 became 7. Fast forward to November 2019 and I now had the time to focus on the remaining recommendations, the first being the inequalities work.
Putting data to use
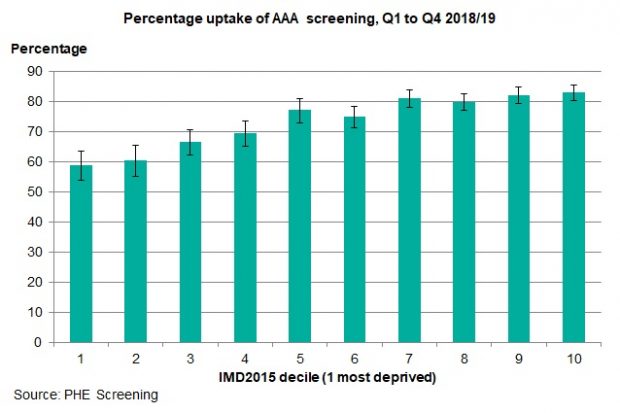
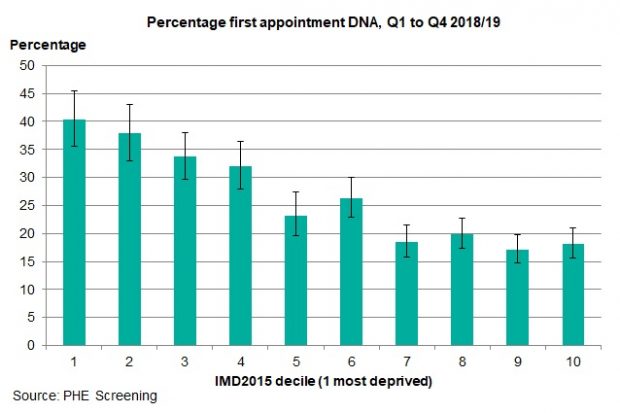
Armed with my laptop, a cup of tea and a biscuit, I began by watching the videos explaining how to extract the data. Then I watched them again and followed the steps, looking first at deprivation and then at ethnicity.
The videos make the process easy to follow and you can see the results not only as figures but also in easy to interpret graphs. The deprivation results were illustrated brilliantly:

For someone like myself who finds using spreadsheets and dealing with data challenging at the best of times, the videos were invaluable as they explained all the steps so clearly.
Focusing effort and resources
Using the results, I was able to write a report to highlight the areas our programme needs to focus on to reduce inequalities. Because of the format of this information, it’s easy for all the team to read and understand, and it gives clear evidence of exactly where we should be focusing our efforts and resources.
Our next step is to finalise a plan to tackle these inequalities and put it into action. At our next team meeting we’re going to brainstorm ideas and discuss the report. We’ve also arranged for the engagement officer from our local diabetic eye screening service to come along to share their experiences of what has worked and what has not.
We’re excited to put some projects in place and hope to see some significant results over time. We’ll present our plan at our next local AAA screening programme board and hope to be able to show how we’re tackling inequalities and improving our overall uptake. We’ll also present the plan at our trust’s quarterly screening committee meeting as a way of sharing ideas and best practice with other screening programmes.
PHE Screening blog
The PHE Screening blog provides up to date news from all NHS screening programmes. You can register to receive updates direct to your inbox, so there’s no need to keep checking for new blogs. If you have any questions about this blog article, or about population screening in England, please contact the PHE screening helpdesk.