We have published the key performance indicator (KPI) non-cancer screening data for the third quarter of 2015 to 2016 (1 October 2015 to 31 December 2015).
KPIs are used to measure how the NHS screening programmes are performing and aim to give a high level overview of programme quality.
Highlights of the Q3 KPI data include:
- for the second successive quarter, we received 100% of submissions from maternity services and 99% of submissions from child health record departments (CHRDs) across the country
- the national average performance across the 6 antenatal KPIs was higher than or equal to the acceptable thresholds
- the national average performance for 2 of the antenatal KPIs (ID1 – HIV screening coverage – and ST3 – completion of the family origin questionnaire) was higher than the achievable thresholds
Receiving 100% of submissions from maternity services is excellent news. This will help ensure the KPI data we publish is robust and represents the whole country. Many thanks to the maternity services and CHRDs for their hard work in completing and submitting this data.
Even with submissions from all maternity units, there are still issues with providing matched cohort data for ID1 and ST1 (sickle cell and thalassaemia screening coverage), with only 90% of data returned for these 2 KPIs.
Table 1 shows the national trend for the previous 4 quarters of the antenatal KPIs, with a comparison to an annual baseline (England data for 2014 to 2015). In quarter 3 (Q3), all the antenatal KPI national average performances were higher than the baseline.
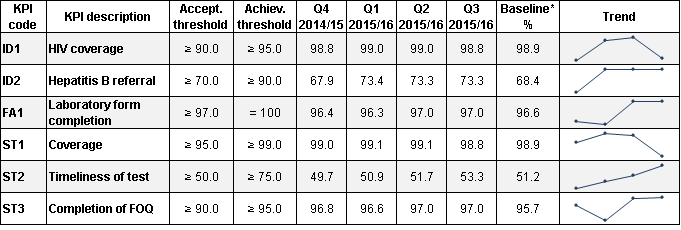
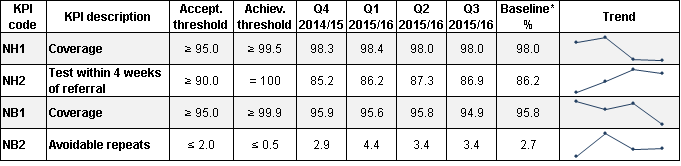
Table 2 below shows the national trend data for the newborn hearing and blood spot screening KPIs, again with a comparison to the England annual baseline.
In Q3, newborn hearing coverage (NH1) remained high at 98%. Timely assessment for screen referrals (NH2) remained just below the acceptable threshold at 86.9% but was slightly higher than the 2014 to 2015 England baseline. NH2 is a small number KPI and should be interpreted with caution.
For coverage of newborn blood spot screening (NB1), the national performance in Q3 dropped just below the acceptable threshold to 94.9%. The national average for avoidable repeats tests (NB2) remained the same as the previous quarter at 3.4% (negative polarity for this KPI where lower is better).
We do not recommend using the newborn and infant physical examination (NP1 and NP2) KPIs as performance measures because of low completeness. The completeness of data for these 2 KPIs in Q3 2015/16 was 73% and 60% respectively.
For the young person and adult non-cancer screening programmes, the abdominal aortic aneurysm screening KPI for completeness of offer is collated cumulatively over the year, so we will look at that more closely after Q4. In Q3, the national average was 80.4%, well above the achievable threshold of 75%.
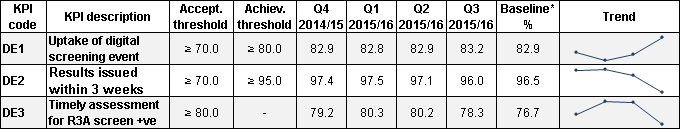
The national trend data for the 3 diabetic eye screening (DES) KPIs is shown in table 3, again with the England 2014 to 2015 data as a baseline.
The uptake of a routine digital screening event (DE1) is a rolling annual KPI and the national average at Q3 was higher than the previous 3 quarters at 83.2%.
DE2 (results issued within 3 weeks) and DE3 (timely assessment for R3A screen positives) both dropped slightly in Q3, although DE3 is a small number KPI and should be interpreted with caution. The recent reorganisation of local DES programmes in London from 17 to 5 may also have had an impact on these KPIs.
Please refer to either the KPI definitions document, or our previous blog post for a detailed list and description of all the KPIs.
Q4 templates published
The 2015 to 2016 Quarter 4 (January to March 2016) templates for maternity services and CHRDs have been published and are available here. The KPI submission window for Q4 is between 1 and 30 June. Please submit your data within this time frame.
Timeline of data publication
You may have noticed that we have published the Q3 data a month earlier than our scheduled publication date. We have been able to achieve this due to:
- increasing numbers of providers submitting good quality data on time
- the hard work of the screening data and information team and the regional Screening Quality Assurance Service (SQAS) in resolving issues with the data
- improved KPI data import-to-publication processes
We have been aware of benefits of early publication of data to services, commissioners, QA services and other stakeholders. We are going to trial this faster reporting process for the next couple of quarters. It is therefore very important that all providers submit data within the submission window. We would like to thank everyone involved with the submissions and the KPI data work.
Each quarter we will publish a blog to signpost the most recent data, summarise key findings and inform you of any KPI-related news.
Minor amendments to the KPI definitions document 2016 to 2017
We have made minor amendments to the KPI definitions document. For the antenatal coverage KPIs (ID1, FA2 and ST1), we have made the wording of the exclusions to the denominator more explicit. For the list of exclusions we have included the words “between booking and testing” after the lines for women who miscarry, or for women who opt for termination.
The 2016 to 2017 KPI definitions document is in the same place as before. Please replace any old saved versions or hard copies to ensure you have the most recent version.
Reminders
As always, any queries, suggestions or feedback about the KPIs should be directed to the PHE Screening helpdesk.
All final KPI submissions should be emailed to phe.screeningdata@nhs.net.
PHE Screening blogs
The PHE Screening blog provides up to date news from all NHS Screening programmes – replacing our previously published newsletters.
You can register to receive updates direct to your inbox, so there’s no need to keep checking for new blogs.
2 comments
Comment by Stella Ward posted on
'The recent reorganisation of local DES programmes in London from 17 sites to 5 sites may also have had an impact on these KPIs'.
Reorganisation was from 17 Programmes to 5 Programmes not 'sites'. Screening sites have on the whole increased across all London DES programmes.
Stella Ward Adult Screening Commissioner NHSE ( PHE embedded staff)
Comment by Denise Dixon posted on
Hi Stella, thanks for your comment. We intended to use the word ‘site’ generically (rather than referring to geographical locations) as we have so many different providers types across the national screening programmes. Thankyou for bringing this to our attention and apologies for the confusion, we have removed the references to ‘sites’ from this sentence.